
 Location :
Climate change has exerted an increasingly profound influence on atmospheric circulation and air quality. Previous studies suggest that global warming, and other climate-related factors can contribute to air pollution in China. However, none of them is sufficient to explain the modulation mechanism of general circulation on air pollution in nature.
In fact, the influence of general circulation on the location of air pollution zone is of great importance to prepare and implement economic development plans, ecological environmental protection policies, and air pollution prevention and control action plans.
In a recent study published in Geophysical Research Letters, the researchers from Institute of Earth Environment of the Chinese Academy of Sciences, collaborating with the researchers from Ningbo University, examined how East Asian winter monsoon (EAWM) modulates the migration of air pollution zone in eastern China, using surface PM2.5 mass concentration monitored by the Ministry of Ecology and Environment of the People's Republic of China, ERA5 reanalysis meteorological data from the European Centre for Medium-Range Weather Forecasts, and global atmospheric transport model GEOS-Chem.
The researchers found that the change in EAWM intensity dominated the location of heavily polluted zone and its meridional distribution. A strong (weak) EAWM caused low (high) PM2.5 concentrations in northern China, highlighting the predominant role of EAWM in redistributing air pollution of China during wintertime.
By analyzing the inter-annual variability and decadal oscillation of EAWM projected in Coupled Model Intercomparison Project (CMIP) models under Representative Concentration Pathways (RCPs) and Shared socioeconomic Pathways (SSPs) scenarios, they forecasted the spatial distribution of air pollution and the position of heavy pollution zone in China during the forthcoming decades.
The results from CMIP5 and CMIP6 models both indicated that, under climate change, the heavily polluted zone is likely to migrate southward in next decades, probably approaching the Yangtze River Delta.
Although there are many uncertainties regarding climate change, the projected inter-annual variability and decadal oscillation of EAWM under RCPs and SSPs are still of great importance in taking measures in emission reduction to achieve clean air in different regions.
To achieve Peak Carbon Dioxide Emissions before 2030 and Carbon neutrality before 2060, China has been making efforts to cut carbon emission. The migration of the pollution zone will inevitably re-distribute carbon sources and sinks in related ecosystem. Thus, understanding the essential modulating factors in the location of air pollution zone and the impact of climate change is crucial to the layout of national economic transformation and industrialization.
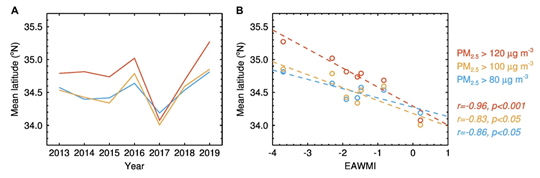
Fig. 1 Mean latitude of the polluted zone varying with the EAWMI. (a) Inter-annual variability of mean latitude of the polluted zone, in which air pollution levels are classified into 3 levels when the winter-mean PM2.5 concentration ≥ 80 μg·m-3. (b) Significant correlations and confidence levels by the Student’s t-test between mean latitude of the polluted zone and the EAWMI. The mean latitude of the polluted zone is linearly correlated to the EAWMI (dashed lines). In particular, the location of heavy polluted zone strongly depends on EAWM (p < 0.001, N = 7). (Image by ZHAO, et al)
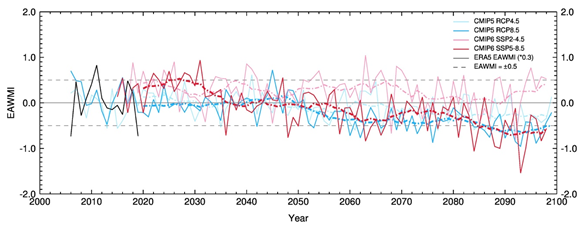
Fig. 2 Time series of ERA5 reanalyzed (black solid line) and CMIP projected EAWMI (colored solid lines) during 2006-2099 under different RCP and SSP scenarios. The CMIP multi-model ensemble EAWMI is an average result from 31 CMIP5 models and 19 CMIP6 models. Colored solid lines represent for inter-annual variability of the EAWMI under RCP4.5 (light blue) and RCP8.5 (blue), and under SSP2-4.5 (light red) and SSP5-8.5 (red), and dashed lines with the same colors represent for 9-point moving averaged EAWMI that indicates the EAWM decadal oscillation. Gray dashed lines are for the EAWMI equaling to ±0.5. (Image by ZHAO, et al)
Contact: Bai Jie, Institute of Earth Environment, Chinese Academy of Sciences, Xi'an, China. Email: baijie@ieecas.cn
 © 2015 Institute of Earth Environment,CAS
 Address:No. 97 Yanxiang Road, Xi'an 710061, Shaanxi, China